 少有人走的路
这个示例程序演示了如何为截面的每个像素计算沿其主轴的区域的厚度。
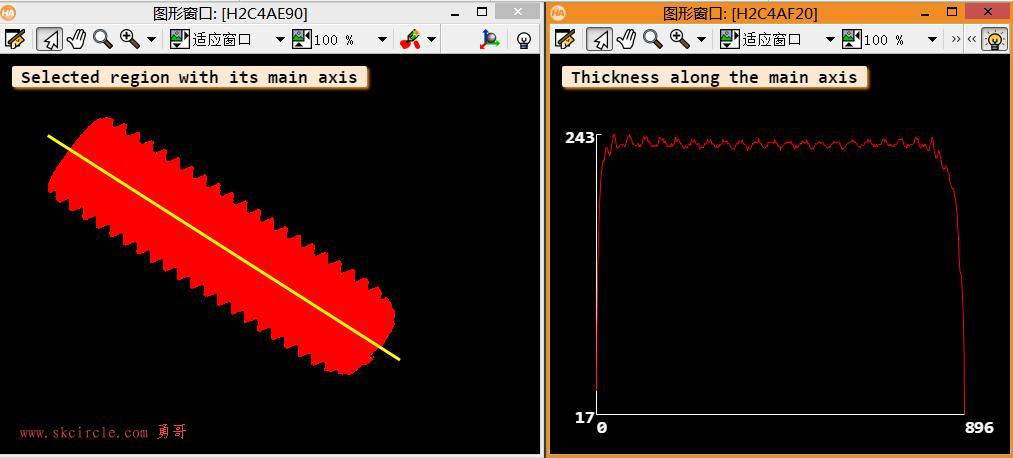
厚度定义为等高线交点与各点(相距最远)主轴垂线之间的距离。
这个示例程序首先通过确定预定义灰度值的连接分量来确定区域。
然后计算了该区域的厚度,并对其主轴进行了可视化计算。厚度在单独的窗口中绘制
dev_update_off ()
dev_close_window ()

read_image (Image, 'screw_thread')
WindowWidth := 540
WindowHeight := 400
dev_open_window_fit_size (0, 0, WindowWidth, WindowHeight, -1, -1, WindowHandle1)
get_image_size (Image, ImageWidth, ImageHeight)
dev_set_part (0, 0, ImageHeight, ImageWidth)
set_display_font (WindowHandle1, 16, 'mono', 'true', 'false')
dev_set_line_width (3)
dev_display (Image)

* 这个程序显示了如何计算一个区域的厚度沿其主轴为每个像素的部分。
* 首先确定一个区域,然后计算沿该区域主轴的厚度
Message := 'This program shows how to calculate the'
Message[1] := 'thickness of a region along its main axis'
Message[2] := 'for each pixel of the section.'
Message[3] := 'First a region is determined and then the'
Message[4] := 'thickness along the main axis of this'
Message[5] := 'region is calculated.'
disp_message (WindowHandle1, Message, 'window', 12, 12, 'black', 'true')
disp_continue_message (WindowHandle1, 'black', 'true')
stop ()
*
*确定厚度
*根据选定的灰度值对图像进行分割,并沿区域主轴计算每个像素的厚度
* the thickness for each pixel along the main axis of the region
threshold (Image, Region, 0, 67)
get_region_thickness (Region, Thickness, Histogramm)
*
* 可视化
* -------------
*
* Display the region
dev_clear_window ()
dev_set_color ('red')
dev_display (Region)
*
* 显示整个区域的主轴
area_center (Region, Area, Row, Column)
elliptic_axis (Region, Ra, Rb, Phi)
StartRow := Row + sin(Phi) * Ra
StartColumn := Column - cos(Phi) * Ra
EndRow := Row - sin(Phi) * Ra
EndColumn := Column + cos(Phi) * Ra
dev_set_color ('yellow')
disp_line (WindowHandle1, StartRow, StartColumn, EndRow, EndColumn)
disp_message (WindowHandle1, 'Selected region with its main axis', 'window', 12, 12, 'black', 'true')
*
* 在单独的窗口中显示厚度分布
dev_open_window (0, WindowWidth + 10, 460, WindowHeight, 'black', WindowHandle2)
set_display_font (WindowHandle2, 16, 'mono', 'true', 'false')
dev_set_line_width (1)
plot_tuple (WindowHandle2, [], Thickness, [], [], 'red', ['style','margin_top'], ['line',WindowHeight * 0.2])
disp_message (WindowHandle2, 'Thickness along the main axis', 'window', 12, 12, 'black', 'true')
几个算子详细解释一下:
(一)elliptic_axis
elliptic_axis(Regions : : : Ra, Rb, Phi)
运算符elliptic_axis计算半径Ra和 Rb以及与Regions中的输入区域具有相同方向和高宽比的椭圆的方向Phi。
几个输入区域可以作为元组传递。 Ra代表椭圆的主半径,而半径 Rb代表椭圆的副半径。
主轴相对于x轴的方向以Phi返回, 以弧度表示。椭圆的主轴等于输入区域惯性矩的主轴。
在操作员region_features的文档中,您可以找到一张图像,该图像说明了其Phi,Ra和Rb不同的区域。
计算方式:
如果将,和规范化并传递到该区域(请参见moments_region_2nd),则半径Ra和Rb、Phi的计算公式为:
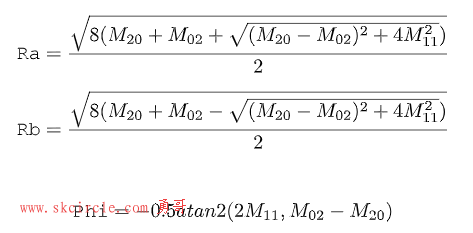
(二)get_region_thickness
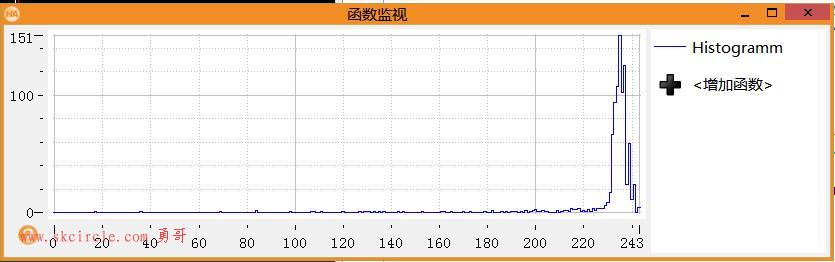
get_region_thickness(Region : : : Thickness, Histogramm)
算子get_region_thickness计算该部分每个像素沿主轴线(参见elliptic_axis)的区域厚度。主轴上某一点的厚度定义为轮廓与主轴上铅垂线相交的点之间的距离,该距离最远。另外,运算符get_region_thickness返回 该区域的厚度的 直方图。直方图的长度对应于观察区域中出现的最大厚度。
---------------------
作者:hackpig
来源:www.skcircle.com
版权声明:本文为博主原创文章,转载请附上博文链接!


")
")
常用的6种方法")
 封装运动功能")